What's new in this Version:
Main features of this version are the extension of analysis- and reporting functionality as well as giving you a new and optimized way to screen your data.
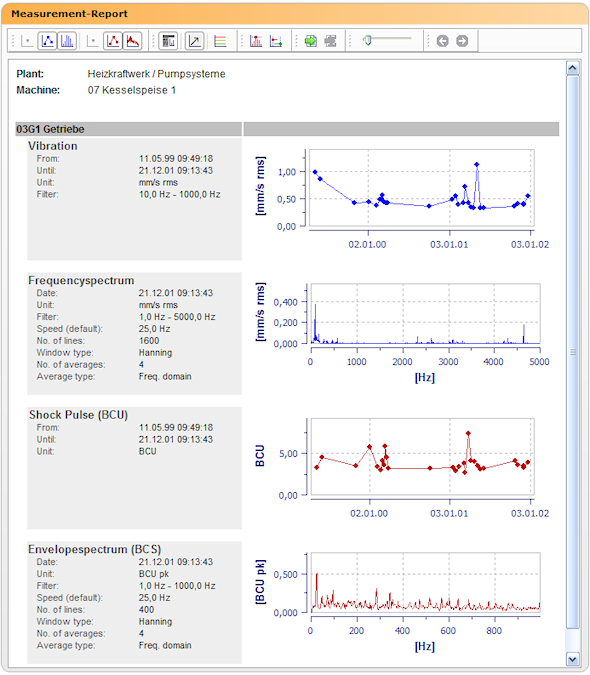
The new 'Measurement-Report' gives you the possibility to see all your measurement trends plus corresponding frequency spectrum and envelope spectrum at a glance- including the possibility to print it out on a single sheet of paper.
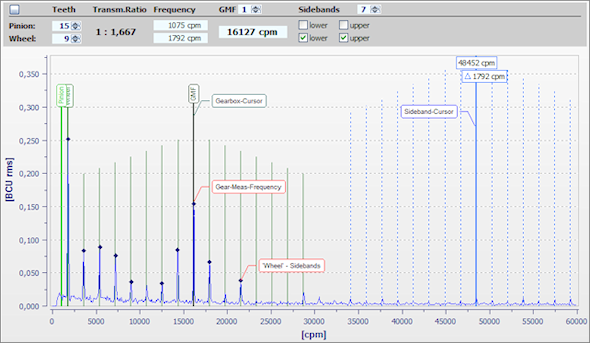
Additionally we have add some new analysis cursors that will help you to examine your data much more efficient than ever.
Last but not least you are now able to display and examine trend plots of your Overall-, BCU- and Bandpass data inside of the analysis module.
To give you a first impression, please see the following samples:
First, the new Measurement-Report:
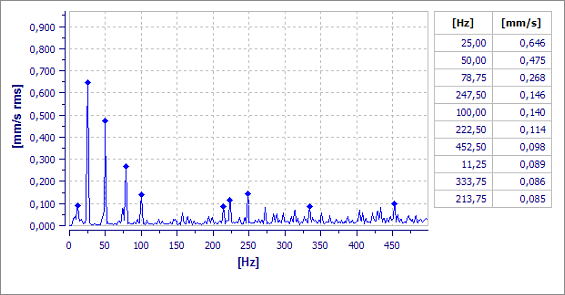
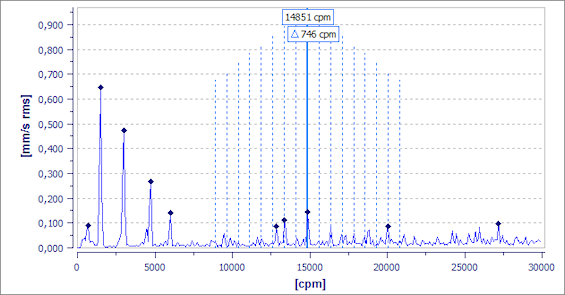
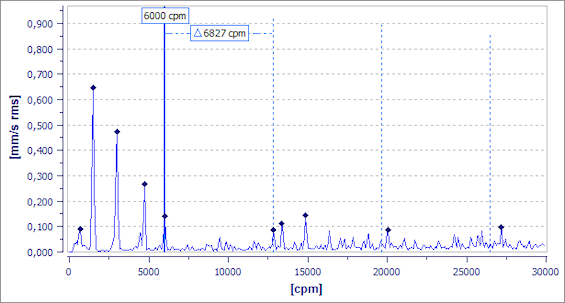
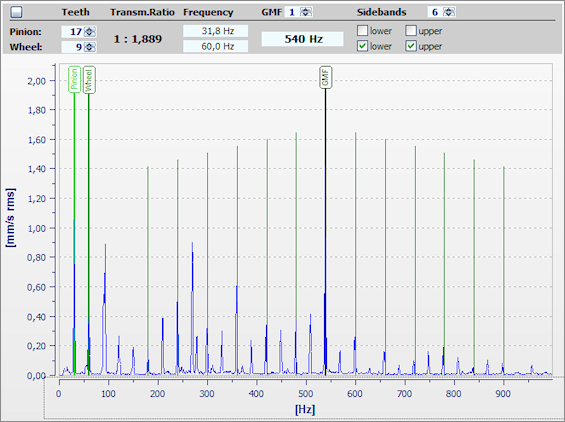
Then, analysis module with some of the newly added cursors:
Read more to learn what function is available in what edition of the Diagnostician.
Basic Edition (1)
-
General
Common color coding for measurement diagrams.
- Overall trend-plots and frequency-spectrum plots are drawn blue colored.
- BCU-trend-plots and BCS-plots are drawn brown colored.
- Bandpass-trend-plots and SED-plots are drawn green colored.
-
Options
All your settings and configurations will now be saved when you leave the software and re-loaded when you start-up the software the next time.
-
Hints
There is a new hint dialog available that explains new users of the diagnostician why they see only their latest measurement values at start-up and what they can do to see all data.
-
New filter functions
Two new filter funtions allow you to hide all measurements that does not contain certain measurement configurations.
- Hide all measurements that does not contain Overall-, BCU- or Bandpass values
- Hide all measurements that does not contain Spectrum-, BCS- or SED values
-
Diagnosis-Report - Adjustable plot height
With a slider control you are now able to adjust the height of all plots inside of the Diagnosis-Report.
-
Analysis - New measurement types available
Now you are able to display Overall-, BCU- and Bandpass trend diagrams inside of the analysis module. Use the Standard-Cursor or the new Text-Cursor (only available in Standard- and Professional Edition) to examine your data or add comments directly inside of your plot.
-
Analysis - Extended 'Standard'-Cursor
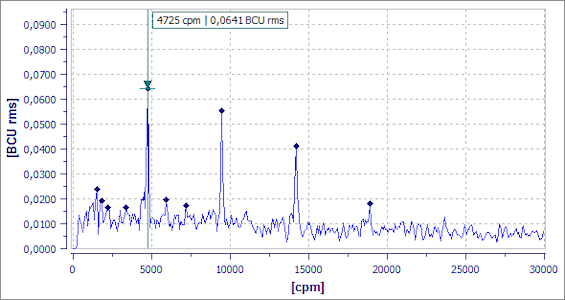
The new 'Standard'-Cursor now displays X- and Y value plus unit inside of its hint area. The new peak indicator let you see your Y value in an easy and comfortable way. Using the Peak-Snap function helps you to select the highest value nearby your cursor.
Standard Edition (2)
-
'Measurement-Report'
The new 'Measurement-Report' presents all your measurement data at a glance. It doesn't matter if you would like to see your machine data or only the measurements of a certain point - the new 'Measurement-Report' is always the right tool. In less than a second (even for large machines) all diagrams were built and displayed - there was never a faster way to screen your data or print out a complete measurement overview of it.
The following data can be (optionally) displayed in the 'Measurement-Report':
- Overall-Trend
- BCU-Trend
- Bandpass-Trend
- Frequency-Spectrum-Diagram (corresponding to the latest trend value)
- BCS-Spectrum-Diagram (corresponding to the latest BCU/BP trend value)
- SED-Spectrum-Diagram (corresponding to the latest BCU/BP trend value)
All plots can be shown with or without measurement setup information.
The height of all plots can be individually adjusted with a new slider control.
Y-Axes normalization is also available.
If you would like to compare trend plots with different time bases, just activate the new X-Axes normalization function and all trend plots will be displayed with a common time base.
Of course its also possible to display your comments that you have made in the Analysis section of the Diagnostician.
-
'Measurement-Overview'
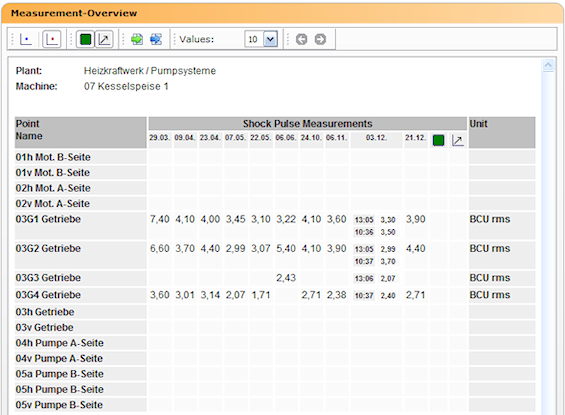
The 'Measurement-Overview'-Report is directly derived from the present 'Machine-Measurement-Report'. While the 'Machine-Measurement-Report' was a mixture of tabular-based and diagram-based measurement representation, the new 'Measurement-Overview' is specialized in showing your data only tabular-based. All diagram-based output is transferred into the new 'Measurement-Report'.
If you would like to know when and at what point your data was measured, the 'Machine-Overview'-Report is exactly the right tool for you.
-
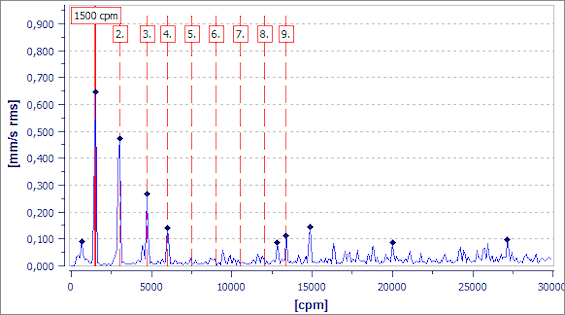
Analysis - Extended 'True Harmonic'-Cursor
Now with optimized hint area.
-
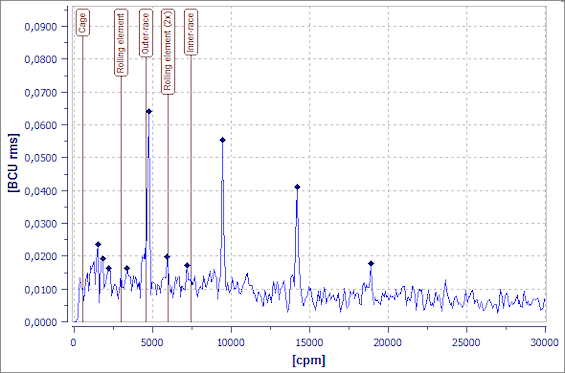
Analysis - Extended 'Symptom-Cursor' [Ball pass frequencies]
Optimized text display
-
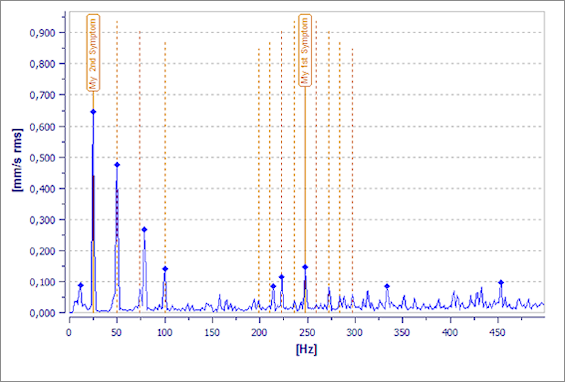
Analysis - 'Symptom-Cursor' [User Symptoms]
Now you are able to show your user-defined symptoms inside of the plot area. This is not only restricted in showing the base line of your symptom - if you have configured harmonics or sidebands, they will be displayed as well.
-
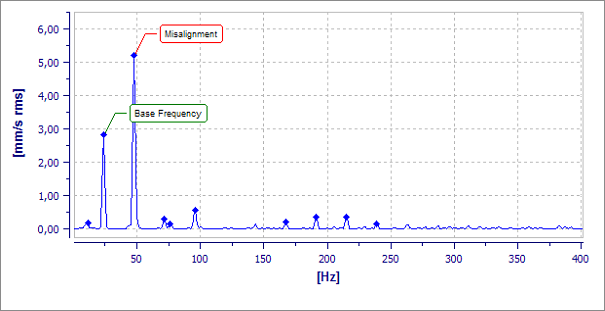
Analysis - 'Text'-Cursor
The new 'Text'-Cursor enables you to display up to 10 individual comments in your plot..
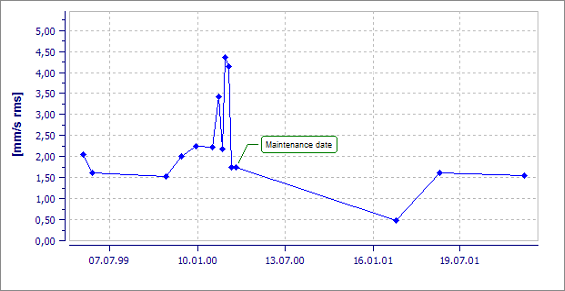
It's available for trend diagrams and spectrum diagrams.
-
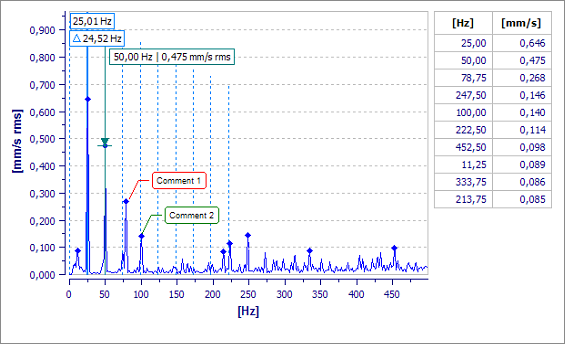
Analysis - 'Plot-Layout' Manager
To avoid overlap errors while using several cursors at the same time in only one diagram the 'Plot Layout' Manager does a hard job in the background of the analysis module.
Professional Edition
(1) All Extensions of the Basic Edition are also available in Standard- and Professional Edition.
(2) All Extensions of the Standard Edition are also available in Professional Edition.


